
6 Trading Chart Patterns that Make Money!
6 Trading Chart Patterns that Make Money!
How To Use Technical Analysis and Chart Patterns To Trade Profitably.
Technical analysis (chart patterns) is a dark art when trading and is often shrouded in mystery.
Technical analysis is looking at the available data in the form of a chart and using this as a tool to spot trends in the price of an asset.
Every chart is just a piece of data telling a story about where the price has been and where that price could go.
Essentially, you're looking at different patterns and trying to spot trends in the market and profit from this movement.
When used correctly this knowledge is going to give you an unfair advantage when deciding on your trading and investing strategy.
In this blog, I give away the six chart patterns that consistently make money.
I have used chart patterns successfully whilst trading natural gas at Shell trading and my trading portfolio.

If you look at most of the research and studies about markets most seem to be about fundamental analysis, you can track data even going back to the 1700s. If you look for some of the research about technical analysis that's been done there is not much quality so this makes it a bit of a dark art.
Technical analysis is more about trading, where you are buying and selling in the short term trying to time the market and make a profit.
This compares with investing where you are buying living breathing companies for the long term
So we've talked in other videos about the difference between trading and investing. I'll put a link to a video up here about how I'd explain that trading is like rugby and investing is like football. So they're very different.
Technical analysis and chart patterns is very much trading, where you're looking at day to day price patterns looking for trends. You're looking at data that's been put into a graph. So every graph is just a part data that tells a story. You're looking at different patterns and trying to spot trends in the market.
Technical analysis is not 100% scientific, meaning if you do the same input you may get different outputs as the world is complex and nothing is predictable. This means to be successful you need to use your intuition and you have to use it's a bit of guesswork of trial and improvement and you need a system that has been successful previously.
Technical analysis is just an additional bit of information that's going to help you decide on your you and on your trading.
Technical analysis is just a different strategy to make money from the stock market. It’s not right or wrong just different. Traditionally Trading is much higher risk and higher rewards than buy and hold investing. This is just a different techniques for different people.
The key to making money in the markets is finding your strength and unfair advantage and utilising these skills
Here are the six patterns that constantly make money
We're gonna go through the six patterns that are going to make make money.
1) The 3 Laws of Motion
2) Support and Resistance,
3) Trend lines
4) Double tops and Double bottoms,
5) Moving averages.
6) And finally, the most speculative is Fibonacci patterns and how interesting they are in mathematical patterns.
These are fascinating and so stay right there. Stay right to the end because we're going to give away the what they are the secret the golden secret of all of trading and this is what many of the trading systems are built on. So stay right to the end, and we will reveal that secret here.
1) Laws of Motion
Think back to your Physics lessons and you may remember Isaacc Newton’s 3 laws of motion. Everything works according to physics and the universe works due to certain laws and there are certain natural laws that everything in the world works. So if you think of the three laws of motion, 1) inertia 2) momentum, 3) every action is an equal opposite reaction. This works in trading as well as physics.

If you understand momentum then you can understand trading. If a stock has momentum behind it, then it's going to keep moving so or if a stock is stuck in a rut in inertia, it's going to be much harder to move than if it is if it's got kind of energy behind it.
3 rd law of motion is that every action has an equal opposite reaction. So every bit of news every bit of information in the market will have a certain amount of a reaction.
Recently, Elon Musk commented about Bitcoin, which affected the price in the market. That action had an equal and opposite reaction. So every certain bit of information, every bit of every point in the market is an action and a reaction. If you think of it like that. It might sound a bit strange, but it comes down to laws of physics and how things all work in the market.
2) Support and resistance.
Support and resistance are the floor (support) and ceiling (resistance) in any trade. These are imagined levels in the market. imagine patterns move up and either get stuck or move down and can’t fall any further. Think of these like a house with a floor and a ceiling, support and resistance essentially the same. You've got resistance is like a ceiling and then support is like a floor.

A stock will find a natural point where it won't go above a certain amount and below a certain amount. So think of the FTSE 100 Sometimes that resistance is 7000 so it won't go above 7000 for ages and this is essentially the resistance so it will keep trading.
It will hit a ceiling all the time that it won’t rise above and this is known as resistance
What Technical Analysis tools to use?
Just look on sites like Yahoo Finance or Google which has good price data and graphs for free. I personally use Yahoo because that's what I started out many years ago using and you can use it for free. It's really good.
Alternatively, you can use a broker site, where you buy and sell your shares. A number of those broker websites or investing platforms have some good packages, and they give those away for free as well. There is much more sophisticated chart patterns available and you can pay lots of money for these packages, to be honest, I think Yahoo or Google is good enough if you're just starting out. Start using those free chart patterns before you pay for any expensive chart pattern software. Don't spend a lot of money on these packages until you're actually making money. There are a lot of adverts out there that are gonna sell you these software packages and tell you that you're going to make millions by having these specialist packages. Start out with the basics and then work your way up.
Support and resistance is like a floor and a ceiling and a price will hit a ceiling all the time until it once it breaks through that ceiling, then it will have the energy to go through that resistance. In general the longer it takes to break through a ceiling the higher it will go long term
You'll start noticing patterns and where it gets interesting is spotting moods, emotions and human psychology. These levels are often set because of automatic stop losses where their trading position is automatically sold so it will hit this point and then it will sell automatically and you'll start noticing that so number one support and resistance. You'll notice these it's just quite often, a price won't go above a certain ceiling or it won't. It won't go below a certain point and this might be the psychology this might be traders love round numbers, so it's quite often a round number so like 7000.
3) Number 3 chart Patterns that Make Money is Trends.
Let the trend be your friend until the bend in the end.
Trend lines show where a price is likely to be heading looking at past performance.
Following the trend when investing is the simplist way to make money trading. It takes more energy to go against the trend than to go with the trend.
A trend is like a river channel with flowing water. These channels move in one direction and takes a lot of energy to break this channel.
You can plot each price point on a graph and see the pattern and general trend.
It’s that easy.

There are trends and you also have a reversal. A reversal is where the price will hit a point and then it will reverse back down. It might have a different trend line going down and it's trying to spot these trend lines.
Double tops and Double Bottoms
Where do these reversals happen? To spot reversals the best way is to look for double tops and double bottoms.
A double top looks like a giant M. This double top signifies the top of the market. So this is where you want to be getting out by selling or shorting your position (making money when the market falls).
As the market is about to crash a double top is like M for Murder (this is how I always remember it). And if you look at the footsie 100 There was a massive M shape or there still is a massive M shape just after the Financial crash in 2007.
It looks like there could be a massive reversal but what happens is that you can never predict just because it's showing in the trends doesn't mean it's gonna happen in reality. What's happening currently is money is being printed by the Bank of England. By printing this money (£875 billion has been printed) means that's the fundamental of goes out the window.
So a double top which signified the top of the market, then next chart pattern is a double bottom. This signifies the bottom of the market. The graph looks like a W. This means there is a solid price floor in place that has been tested. This could mean the bottom of the market. So that's a double bottom.
Here the chart looks like a W for win as this is a sign of a reversal.
So you've got M for Murder, which is signifies the top of the market that will then you've got a W for win which indicates a bottom of the market. The double bottom reversals means it’s going to mean it's going to start another Bull Run.
Moving Averages
The next chart pattern is moving averages. So what is a moving average? So essentially it's just the average of the price so what you can do, you can essentially look at different daily averages. So you can do this automatically in Yahoo or Google or your broker site and you can set your moving average to a number of different points depending on what you're analysing what fundamentals you're looking at.
It's the average of the last few days you do a daily moving average. So I use moving averages to see the general price trend. Moving averages can be a leading indicator so can predict where the price of something will go. A good moveing average to use is a 200 day moving average and a 50 day moving average. What you're looking at is the momentum in the market. So is the 200 day moving average, less than you might have less than 50.
What will happen is you'll get you'll get you get these two moving averages crossing over each other to signify which way the market will move. A Golden Cross, which means is it going to go up and then or you get a death Cross, which essentially means the markets gonna go down.
What I used for the FTSE 100 is 200 daily moving average and 50 day moving average and look for these crossovers and essentially that's where the moving average move the 200 day moving average crosses over the 50 day moving average. And that is that is going to signifies it moving up or it's going to move down so most of the time they run parallel to each other these two moving averages and then if a crossover then that signifies essentially signifies a change in the market, and that's what they're looking for. And then if it's a daily death cross where I think it is the 200 day moving average goes over 50 Moving Average, then that's a bad sign. That means that's going to be a bear market. And if you have a golden cross where the 200 day move every move the 50 day moving average is in that second Golden Cross and that means it's going to signify a bull market, which means it's going to move up again. That's moving averages and you can play around with I use a 50 day moving average to 200 day moving average, just because that's a good one to use. You can play around with different ones and there are other traders who use different moving averages to me.
So the final one is Fibonacci patterns. And so this is the one I was going to reveal at the which I said I'd reveal at the end of the start of the talk.
I say what is Fibonacci is he was an Italian economist in the 13th century. Since he he spotted these patterns in nature. So he's spot a spot it is a mathematical pattern and essentially he spotted things like if you look at sunflower seeds, if you look at petals of the petals in a rose and you look at or even if you look at beauty, so if you look at a beautiful person, they will have these Fibonacci patterns and is a sequence so it's where the previous two numbers add up together. Add up to the next number. So for instance, when the Fibonacci pansies, one one, and add those two numbers up equals two, and then the next number in the sequence is one, two, adding them up together is three Google is fascinating these patterns, and essentially, this these patterns are everywhere in nature. And we talked about this on my podcast, where I interview a trader who use Craig's company called trade the easy way and he talks about this is the secret to trading a lot of the trading software are built on these Fibonacci patterns. And essentially, you can use this for your trading and your this. This is more sophisticated trading software and you can pick up these Fibonacci patterns and essentially are looking for where these Fibonacci patterns are in one two, this basically shows exponential growth. So Fibonacci is Italian economist or mathematician. Use the example of these in rabbits and essentially, if you put two rabbits together, it will create three dad and the mom and the baby rabbit and essentially if you put them in a room, you get these kind of exponential patterns. And this the same way the trading patterns, and it's fascinating, these patterns, and you can kind of find out more about this by doing your own research, but it's just an introduction to these patterns. So yeah, that has been an introduction to to trade into trading patterns. So as I said, this is trading or investing. Please do your own research. Capital is at risk. And this is guidance, not specific advice. So I offer money coaching, and offer where we empower you to make your own decisions with money. So let's go through those six trading patterns just briefly again, so Support and Resistance this is your ceiling and your your floor of your patterns.
This is then we talked about trend lines. So let the trend be your friend to the bend in the end. So it's much more smarter to follow the trend lines, rather than trying to predict where it's going to break and you're going to find a new bear market or bull market is much, much smarter follow the trends, then you're looking for those as far as the trends rather than the reversal rate. Then we talked about double tops, look for those that end and that means end for murder. That means it's going to be a change to a bear market where the markets gonna go down and then we talked about a double bottom, which is a bit like W for when and that's that's going to be the bottom of the market and it's going to start a new bull market. Then we talk about moving averages. So we talked about the 200 day moving average using a 50 day moving average, and you can play around with this on software that we Yahoo Google all your breakroom sites.
Fibonacci patterns
Fibonacci patterns are everywhere in nature including sunflowers, stars and the human body. These patterns were discovered by an Italian mathematician called Fibonacci.

And these are fascinating patterns and are essentially the secret code to trading. And yeah, a lot of the trading activities are built on these Fibonacci patterns. It shows perfection in nature and in trading it shows exponential growth.
These are used in trading by looking at key reversals in graph patterns. You can get trader software which will easily show you the Fibonacci patterns to help you spot profitable trades.
Wish you were better at trading the markets?
The 3 biggest factors to being successful as a trader is
1) Having a successful system,
2) Measuring your results and
3) Following it with discipline.
Trading gives you the time freedom to work as little or as much as you like, as a side hustle or a full-time career.
The goal of any trader is to make a profit regularly, yet few people ever accomplish this consistently.
Less than 1 in 4 retail traders make a profit (according to the latest research!)
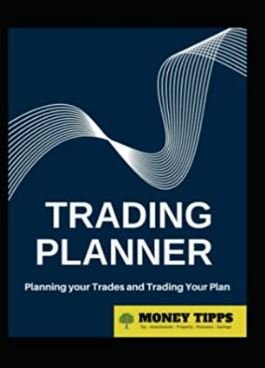
To improve your chances of creating a profit I have created the ultimate Trading planner!
One of the most important factors of trading success is tracking your trades. This means you base your decisions on evidence, data and numbers.
I wish I had this planner 20 years ago when I started working on one of the World's largest trading floors in 2002.
I personally use this Trading Planner for my own trading portfolio.
Measuring, managing and improving my trades.
Writing down your goals, and tracking your trades can significantly improve your success!
This Trading planner detaches you from the emotions of the markets today to improve your success tomorrow.
Buy this Trading Journal now by clicking below
Millennial Money Mindset® was shortlisted by the Financial Times writing prize and was an Amazon bestseller!
If you want to get closer to Financial Independence and Retire Early (FIRE) get your copy today on Amazon by clicking the link in the comments.
Get your book in print, an ebook or audio versions of Millennial Money Mindset by searching Millennial Money Mindset on Amazon.
Or just click this link to buy now

Each copy bought we will plant a tree 🌳 on your behalf to help in the fight against climate change 🌍
Do you think education should be accessible for the many and not a privileged few?
Please like, comment and share as it empowers more people to manage their own money
To buy your copy today simply search Millennial Money Mindset and buy on Amazon to start your journey to financial independence.
It could be the best investment you make this year!